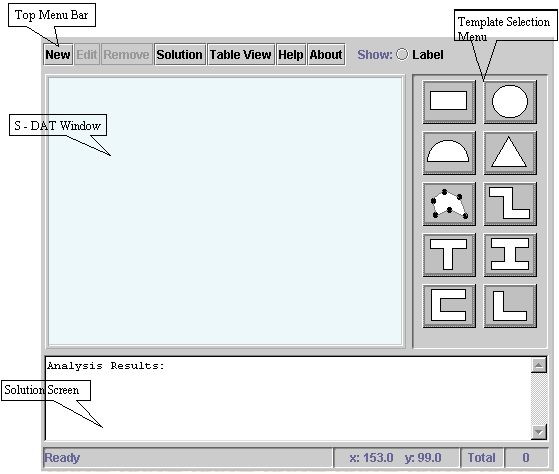
You can use S-DAT to model two-dimensional shapes of varying degrees of complexity, and to obtain their corresponding geometric properties as listed below:
- Area - (S)
- Centroid - (Xc, Yc)
- Centroidal Moments of Inertia - (Ixc, Iyc)
- Product of Inertia - (Ixcyc)
- Polar Moment of Inertia - (J)
- Radii of Gyration - (pxc, pyc)
- Polar Radius of Gyration - (pzc)
- Orientation Angles of Principal Axes - (Amax, Amin)
- Principal Moments of Inertia - (Imax, Imin)
S-DAT does not use any specific system of units. It relies on you to provide it with a consistent system of units, whatever it may be. The answer for each geometric property will be in the units you are using. If you specify all the dimensions in inches, then the units that should accompany individual properties are as follows:
- Area - in2
- Moment of Inertia - in4
- Radius of Gyration - in
- Orientation angles - degrees
You can simply click on any of the icons in the Template Selection Menu to create a simple model. If the shape you want to create cannot be found among the templates shown, then go to question number 10 for more information.
Once you click on one of the templates, a separate screen will appear that contains several blank fields to input the necessary geometric data. An example template for the Z-section is shown below.
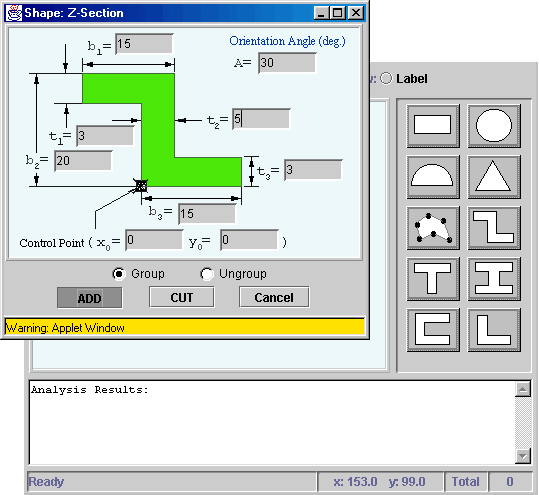
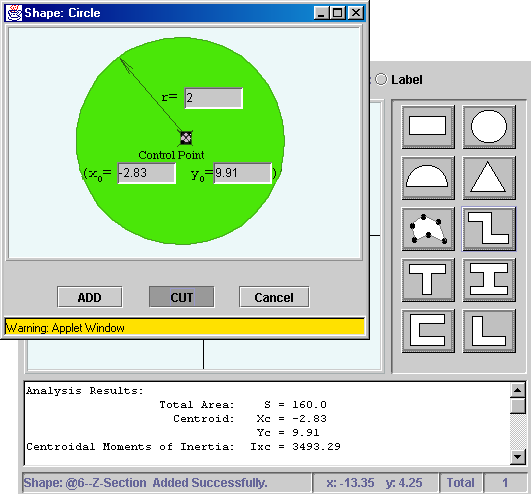
The Control Point is used as a means of specifying the location of a shape relative to the user-specified reference coordinate system. If you give a value of zero to x0 and y0, then the Control Point coincides with the origin of the reference coordinate system. Note that the reference coordinates are not shown on the screen; only the centroidal coordinates xc and yc are shown. Keep in mind that the centroid of the shape is measured relative to the reference coordinate system.
You can also rotate the shape to any orientation by specifying a non-zero value for Rotational Angle, A, which is measured in degrees.
Some templates have "Group" and "Ungroup" buttons. The ungroup button can be used to divide the shape in the template into separate rectangular pieces. Then each rectangular piece can be modified independently of the others.
To see the shape in the S-DAT Window, simply click on the ADD button. The Cancel button is used to abort the insertion or deletion of the given shape.
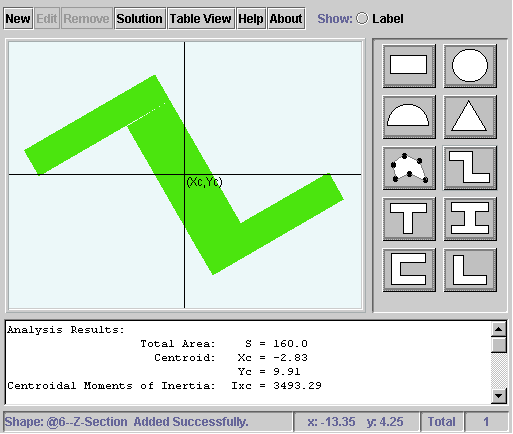
The xc and yc represent the horizontal and vertical centroidal coordinates, respectively, of the shape that appears in the S-DAT Window. Keep in mind that the moments of inertia Ixc and Iyc are measured with respect to these axes irrespective of the orientation of the shape as specified by Rotational Angle, A.
The centroid of the shape shown in the S-DAT Window is measured relative to the reference coordinate system, which is defined according to the values specified for the coordinates of the Control Point, x0 and y0. In the case of a complex or built-up shape, the reference coordinates are determined by the Control Point coordinates specified for the first element drawn in the S-DAT Window.
The solution for each geometric property can be viewed by clicking on the Solution icon in the Top Menu Bar. The left portion of the window indicates the properties of the model that are calculated. By default, the steps in the solution for each property are described. You can, however, choose not to view a particular property by removing the x in the check box associated with that property.
The right portion of the window first explains in detail all the steps involved in obtaining the solution for each element of a built-up shape, and then displays the results for the built-up model.
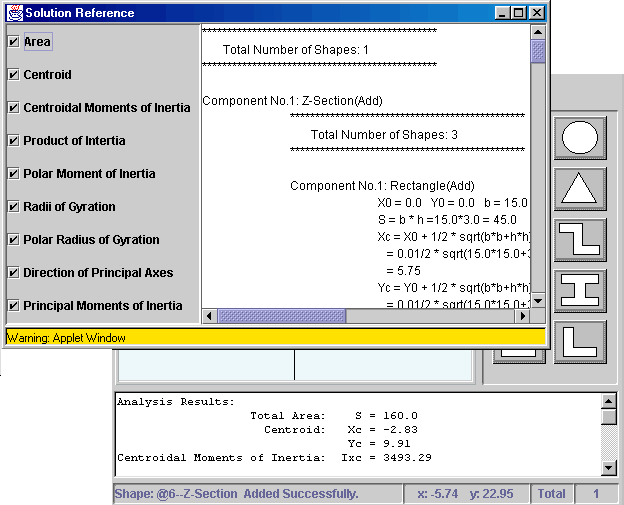
A1 and A2 represent the orientation angles corresponding to the principal axes of individual elements in the built-up shape. The corresponding principal moments of inertia are identified as I1 and I2, respectively. Amax and Amin represent the orientation angles corresponding to the principal axes of the built-up shape. The corresponding principal moments of inertia are identified as I1 and I2, respectively.
Click on the shape in S-DAT Window that you want to edit. A black border appears for the highlighted shape. Then click on the Edit icon in the Top Menu Bar. Modify the values and click OK to save it or Cancel to keep the original values.
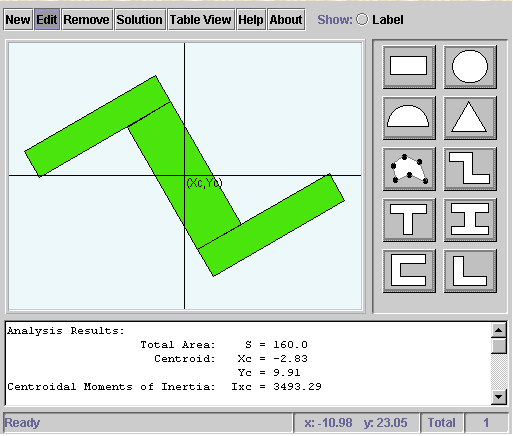
Repeat the same procedure if you want to edit more than one shape in case of a complex model. You can select the Label button in the Top Menu Bar to identify the individual shapes in a complex model.
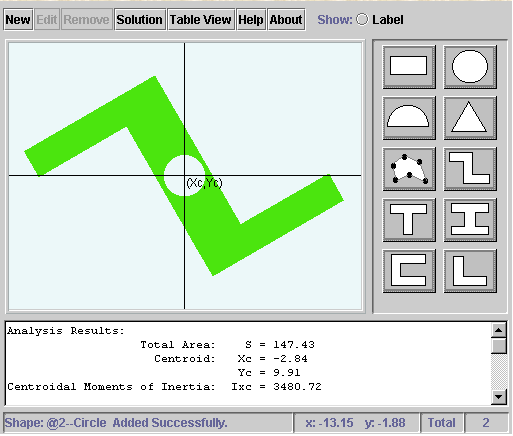
A cutout is treated like any other geometric entity. If the shape of the cutout can be described by any of the shapes in the Template Selection Menu, then simply click on the corresponding icon, specify the data, and finally click on CUT to remove that part from the existing shape in the S-DAT Window.
You can also remove an element of an existing shape. To do this, click on the element in the model you want to remove. A black border appears for the highlighted shape. Then click on Remove in the Top Menu Bar. Repeat the same procedure if you want to remove more than one segment.
You can also use the New button to erase the current model and to build a new one. Notice that once the New button is pushed, the erased model cannot be recovered.
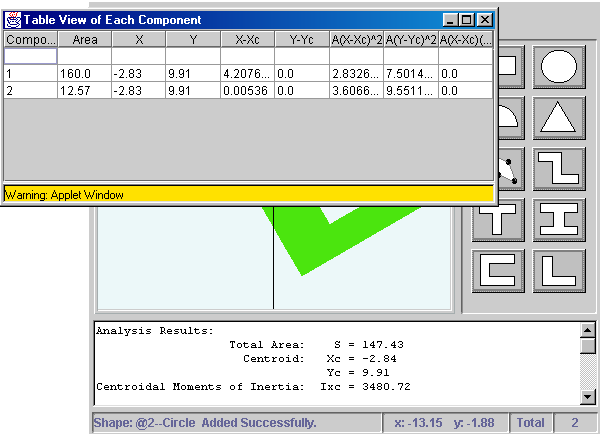
Select Table View in the Top Menu Bar in case you wish to see a chart of the individual components of the model useful in calculating centroidal moment of inertia and product of inertia of the complete model, in case you decide to solve the problem on your own.
First divide your model into basic shapes among the given templates.
Say we want to develop a shape as shown in the figure below.
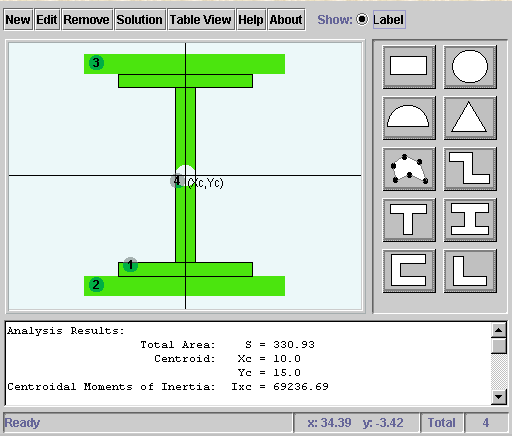
Click on the I-section icon from the Template Selection Menu to built a I-section with following geometric data and b1=20, A=0, t1=2, b4=8.5, t2=3, b5=8.5, t3=2, b2=30, b3=20, x0=0, y0=0 then click Add.
Then select Rectangle icon with the data b=30, h=3, x0=-5, y0=-3, A=0. Note here x0 and y0 are with respect to the control point of the 1st element and click Add.
Again select the rectangle section with the control point changed so that this section fits on top of the I-section. The values are b=30, h=3, x0=-5, y0=30, A=0 and click Add.
Let's have a hole in the center. Select circle from the template selection menu, enter the values x0=10, y0=15, r=1.5 and click Cut.
The model likes the one shown in the figure above.
You can edit the shape using the method shown in question number 7 or remove the shape using the method shown in question number 8 to change any of the geometric data.
We hope this demo was useful to you. Go ahead and start playing with your own models.